
What Is a Liquidity Sweep
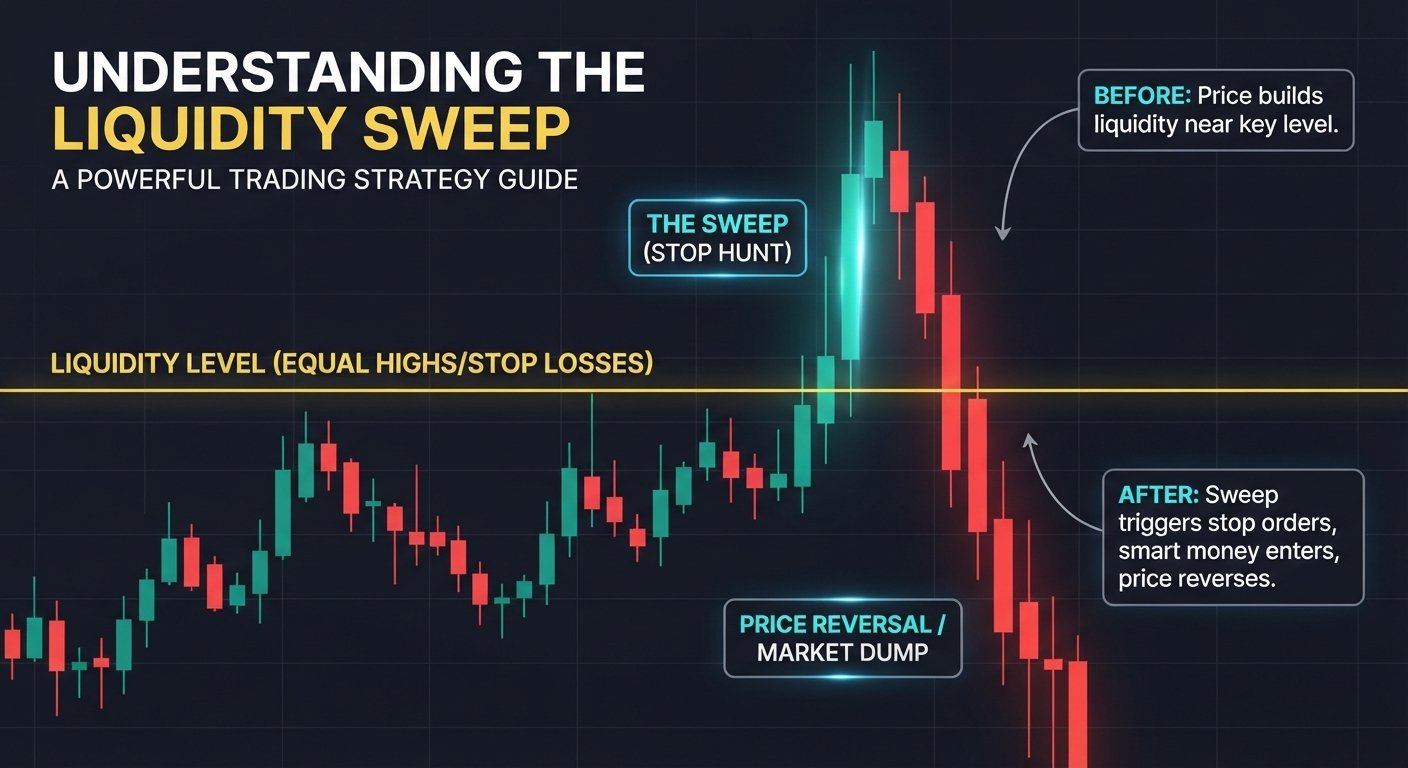
What Is a Liquidity Sweep? This sort of liquidity sweep trade is used by traders of both price-action and liquids trading in order for them to understand and take advantage of reason for this pull back in price, where orders(stop or pending order or break out orders) is “swept away”. This could present itself as a candle with a wick above or below a level where there are a sizable amount of sell stop and sell break orders.
The concept of what is a liquidity sweep is especially common in discussions of institutional trading, smart money concepts, market structure, and forex or futures price action. A sweep can occur above a previous high, below a previous low, around equal highs or lows, or near another level that attracts a large number of orders.
Basically the idea is this the price is going to gravitate toward an area of liquidity, blast through that liquidity and then either turn around, or break right through it. Standing by itself the sweep does not tell you where it goes, you need context. These moves allow the trader to figure out when a real breakout has actually occurred, vs just a brief impulse into an area of price to sweep liquidity to gather buy/sell orders. It tells you why price is able to come bust a major high or low, then flip.
Why Does Liquidity Matter?
Liquidity refers broadly to the availability of buyers and sellers willing to transact at different prices, which is a fundamental concept in financial market liquidity and helps explain how efficiently assets can be traded.
Understanding what is a liquidity sweep also requires recognizing that certain price levels can become particularly important because many market participants place orders around them.
Obvious highs and lows are common examples. Traders frequently use previous swing points for stop-loss placement, breakout entries, support, resistance, and risk management.
As a result, these areas can contain clusters of orders.
Buy-Side Liquidity
The Buy-side liquidity will be associated more with the positions higher than the current highs. Long-position holder may place their stops beyond the current high and the other party may also look to buy at breaking beyond the higher.
That creates potential liquidity above the highs.
A move through this area can trigger several orders in a relatively short period.
Sell-Side Liquidity
Understanding what is a liquidity sweep also involves recognizing sell-side liquidity, which is commonly found below recent lows. If any of those bulls want to close out trades, they might set stops under the previous low. If a breakdown trader is looking to come in at these times, they might put sell-stops under the low. The break lower and bounce is seen as a sell-side sweep. We are saying where a potential spot is for an order, not calling it either.
How a Liquidity Sweep Develops
A typical sweep can be understood through several stages.
1. A Clear High or Low Forms
The market establishes a recognizable swing point. It might be a previous daily high, an intraday low, or a level that has been tested several times.
The more obvious the level appears, the more likely it is to attract attention from traders.
2. Orders Accumulate Around the Level
Different participants may place different types of orders near the same area.
A short seller might place a stop above a recent high. A breakout trader could place a buy-stop in roughly the same region. These orders have different purposes, but both can contribute to buying activity if price moves upward through the level.
3. Price Reaches the Liquidity Area
As price approaches the level, trading activity can increase. Traders watching the area may prepare to enter or exit.
The market may then move through the high or low.
4. Orders Are Triggered
Once price reaches the relevant levels, stop orders and other pending orders can become active.
This can produce a quick extension beyond the previous high or low.
5. Price Either Rejects or Continues
This is where interpretation becomes important.
If price quickly returns inside the previous range, traders may view the movement as a liquidity sweep followed by rejection.
If price remains beyond the level and establishes acceptance there, the move may instead represent a genuine breakout.
A sweep therefore cannot be confirmed simply because price crossed a previous high or low.
Liquidity Sweep vs. Breakout
One of the most common questions is how to distinguish a sweep from a genuine breakout.
The difference is primarily based on what price does after crossing the important level.
| Liquidity Sweep | Breakout |
| Price briefly moves beyond a key level | Price moves beyond a key level and holds |
| Often followed by rejection | Often followed by continuation or consolidation above/below the level |
| May return inside the previous range | May establish a new trading range |
| Can trigger stops before reversing | Can attract additional participation in the breakout direction |
| Confirmation usually requires further price action | Confirmation may come from sustained acceptance beyond the level |
There is no universal candle pattern that perfectly separates the two.
A trader should be considering: the setup, the time frame, (volume if available) the momentum, the nearest support or resistance, and then, importantly, price action immediately following the move. Breaking a prior high, even closing above, is not necessarily a quality breakout, for example. Likewise, a brief pierce of previous resistance, doesn’t mean we have a reversal on the cards.
Common Types of Liquidity Sweeps
Liquidity sweeps can occur in several forms.
Sweep of Equal Highs
When price forms two or more highs at approximately the same level, traders often pay attention to the area above them.
A later move above those highs can trigger buy-side liquidity. If price subsequently falls back below the level, the movement may be interpreted as a sweep.
Sweep of Equal Lows
The opposite pattern occurs when multiple lows form around a similar price.
A move beneath those lows can trigger sell-side orders. A recovery above the area may indicate that the downside move was rejected.
Previous-Day High or Low
Day traders often monitor the previous trading day’s high and low.
These levels are widely visible and can become reference points for intraday traders. A temporary move beyond one of them may attract attention, particularly if it occurs during an active trading session.
Session Highs and Lows
Forex and futures traders may also monitor highs and lows established during particular market sessions.
A later session can trade through those levels, creating a potential liquidity event. The significance depends heavily on the broader market structure and trading context.
Major Swing Points
A prominent swing high or low on a higher timeframe can attract orders over a longer period.
A move through such a level may have greater significance than a small intraday fluctuation, but the trader still needs confirmation before assuming a particular outcome.
How Traders Identify a Potential Sweep
Potential sweep is found in the same way as liquidity areas are spotted. The concept behind this relies on being able to distinguish these significant area or levels where the most trading occurs. Clear recent high’s and lows of the graph will appear to be the most straightforward level to focus on.
Most times when looking for recent highs and lows traders pay close attention to Equal Highs and Equal Lows, Extreme values from the previous market hours and swing highs/lows of a large nature.
That would then be paired with what overall structure the price is currently in. Price action for a trend bull market, even when push to barely miss a recent low, will not carry near as much weight compared to a drastically bear market in terms of execution of the same price action in a very similar area on the graph. The surrounding conditions give context on whether traders expect to see reversals, continuation of the market, or if they will perceive it as little more than noise. Probing price action occurs here and the close examination will begin for quick rejection, and a successful hold as a result, or a sustained push outside the given area of liquidity.
A Practical Step-by-Step Approach
A structured process can help prevent emotional decisions.
Step 1: Mark Important Highs and Lows
Start with the timeframe relevant to your trading strategy. Mark obvious swing points and areas where price has repeatedly reacted.
Avoid filling the chart with every minor fluctuation. Focus on levels that other market participants are reasonably likely to notice.
Step 2: Identify Potential Liquidity
Look for clusters of similar highs or lows, previous session extremes, and clearly defined swing points.
Ask yourself where traders might logically place stop-loss or breakout orders.
Step 3: Wait for Price to Reach the Area
Do not assume that because liquidity exists at a certain level, price must reach it.
Let the market approach the area before making an interpretation.
Step 4: Observe the Reaction
Once price crosses the level, watch what happens next.
Does price immediately return inside the previous range? Does it produce strong momentum in the opposite direction? Or does it continue moving beyond the level?
This reaction is often more informative than the initial breach.
Step 5: Look for Additional Confirmation
A liquidity sweep should not automatically become a trade signal.
Depending on the strategy, traders may look for a change in market structure, rejection candle, follow-through, retest, or another predefined confirmation.
Step 6: Define Risk Before Entering
Determine the invalidation point before taking the trade.
A setup that only works if everything goes exactly as expected may not offer sensible risk management.
Liquidity Sweep and Market Structure
Liquidity analysis becomes more useful when combined with market structure.
Market structure describes the sequence and relationship of highs, lows, trends, and breaks in price behavior, providing a framework for understanding technical analysis and interpreting price movements.
For example, suppose price is moving lower and repeatedly producing lower highs and lower lows. Price then briefly falls beneath a previous low but quickly recovers and subsequently breaks above a recent lower high.
A trader using a liquidity-based framework might interpret the sequence as a sell-side sweep followed by a bullish structural shift.
That interpretation is more meaningful than simply saying, “Price went below the low, so I should buy.”
The sequence matters.
Likewise, a sweep above a high followed by continued upward structure may not indicate a reversal at all.
Common Mistakes to Avoid
Treating Every Wick as a Sweep
A long wick beyond a high or low can be interesting, but not every wick represents a meaningful liquidity event.
Normal volatility, spreads, news, and temporary order imbalances can produce similar price behavior.
Assuming a Sweep Guarantees Reversal
This is one of the most dangerous assumptions.
A market can take liquidity above a high and continue rising. It can also move below a low and continue falling.
The sweep itself is not a guaranteed reversal signal.
Ignoring the Higher Timeframe
A small liquidity event on a five-minute chart may occur inside a strong daily trend.
Looking at multiple timeframes can provide useful context and help prevent a trader from assigning too much importance to a minor intraday movement.
Entering Too Early
Some traders see price touch or cross a liquidity level and immediately enter in the opposite direction.
That can be costly if the market continues through the level.
Waiting for predefined confirmation may reduce the number of impulsive trades, although no confirmation method can eliminate losses.
Placing Stops Where Everyone Else Does
A trader who understands liquidity may become overly focused on placing stops away from obvious levels. That does not automatically make the trade safer.
The stop should reflect the trade’s actual invalidation point and appropriate risk management rather than simply trying to avoid being part of a liquidity pool.
Special Situations That Can Change the Setup
Not every market environment behaves the same way.
Major Economic News
Economic releases can create rapid price movements and temporary spikes through important highs and lows.
During these periods, distinguishing a deliberate-looking sweep from normal news volatility can be difficult.
Low-Liquidity Sessions
Markets can behave differently when participation is limited. Price may move sharply through nearby levels with relatively little activity.
Strong Trending Markets
In a powerful trend, apparent sweeps can become continuation events rather than reversals.
Trying to fade every new high or low simply because it contains potential liquidity can work against the prevailing market structure.
Highly Volatile Assets
Cryptocurrencies and other volatile instruments can produce frequent movements beyond obvious levels. A trader may therefore see many apparent sweeps that do not lead to meaningful reversals.
The more volatile the instrument, the more important it becomes to consider the size of normal price fluctuations.
Does a Liquidity Sweep Mean Institutions Are Manipulating the Market?
Phrasing about liquidity sweeps has often given me the impression of big institutions trying to hunt individual traders’ stops in particular. I try to take these kind of arguments with a grain of salt. In a market, many participants have varying goals.
Sometimes it’s possible that the price will pass an obvious level that contains a lot of clusters of stops naturally.
You aren’t able to directly attribute a run of highs directly to one institution who is solely hunting retail traders and their stops. The liquidity logic can be applied without implying any manipulation. Ask not, ‘Who took out the stops’ but, rather, ‘What occurred to price after passing where a number of orders were predicted to be situated’
Can Liquidity Sweeps Be Used in Every Market?
In general terms the principle could be applied to many markets where historically orders tend to transact around specific prices, be it equities, futures, Forex or crypto. However the characteristics of the available information will vary. Some markets will provide clean order book information, while others will display distributed activity across multiple venues.
Traders need to appreciate this to understand the limitations of their display.
Shape and chart behaviour is dictated by such factors as time of day, volatility, market structure, and liquidity.
How Risk Management Fits Into Liquidity Trading
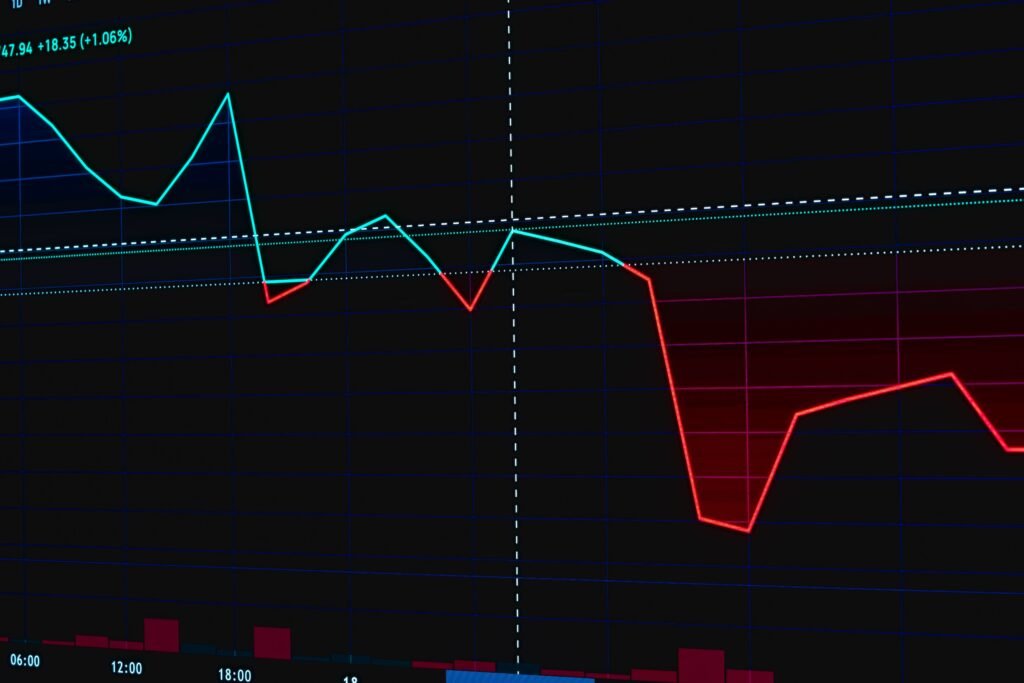
A strong liquidity-based setup still requires risk management.
No chart pattern can guarantee that a trade will work. Even a convincing sweep followed by apparent confirmation can fail because of new information, volatility, or an unexpected change in market conditions.
Risk management should therefore come before the excitement of finding a setup, making broader trading risk management principles an important part of any liquidity-based approach.
Traders would have to weigh how much of what they are prepared to put on risk, their invalidation point, and whether the reward to risk is worth it. Other ideas that come to mind are liquidity based set ups-reviewing your own past trades will indicate whether that kind of sweep under strategy rules works for you.
Final Takeaway
A Liquidity Sweep is a price move through a price range that could be the resting place of some large orders it can even incorporate some “obvious” highs/lows (previous high/low, same high/low price levels, even previous days extremes) It can even flush out stops and initiate some large breakaway order flow, but can price then resume in the opposite direction OR can it really break out?. The key take away is when you’re watching the prices reach a high or low don’t automatically think it’s going to reverse but take a wider view of the overall market environment, where the price got to, how quickly it retracted or sped up once it crossed over a level etc.
Make sure before you enter any trade, you know the risk to reward.
Usingliquidity to analyze price can offer you another edge, another way for you to understand whyprice interactionshappen where they seem to; there’s no magic, every trade is unique so apply your strict trading discipline and it will prove invaluable.
FAQs About Liquidity Sweeps
1. What is a liquidity sweep in trading?
A liquidity sweep occurs when price moves beyond an obvious high or low where stop-loss and pending orders may be concentrated, then reacts from that area. Traders often use the pattern to assess whether a breakout may fail or whether price is likely to continue.
2. Is a liquidity sweep the same as a stop hunt?
The terms are often used interchangeably, although “liquidity sweep” is more common in Smart Money Concepts and ICT-style trading. Both generally describe price moving into an area where orders are clustered before a reaction.
3. Does every liquidity sweep lead to a reversal?
No. A sweep does not guarantee a reversal. Price can reject the level and move in the opposite direction, but it can also accept prices beyond the level and continue the existing trend. The price action that follows the sweep is therefore critical.
4. How can I identify a liquidity sweep on a chart?
Look for a clearly visible swing high, swing low, equal highs or lows, range boundary, or another level where orders may be concentrated. Then observe whether price briefly moves through that area and subsequently rejects it or establishes itself beyond it.
5. What is the difference between a liquidity sweep and a breakout?
A genuine breakout generally shows acceptance beyond the previous level, while a sweep often involves a move through the level followed by rejection. The distinction is not always obvious immediately, so traders should avoid assuming that every brief move beyond a high or low is a sweep.
6. What are buy-side and sell-side liquidity sweeps?
A buy-side sweep occurs when price moves above a previous high and reaches orders positioned there. A sell-side sweep occurs when price moves below a previous low and interacts with orders beneath that level. The terms describe which side of the market’s liquidity was targeted.
7. Can beginners trade liquidity sweeps?
Beginners can study the concept, but a sweep should not be treated as a standalone buy or sell signal. Understanding market structure, confirmation, position sizing, stop placement, and risk management is essential before using the setup with real money.
8. Which timeframes are best for spotting liquidity sweeps?
Liquidity sweeps can appear on virtually any timeframe. Some traders identify important liquidity areas on higher-timeframe charts and then use lower timeframes to study the reaction. The most appropriate timeframe depends on the trader’s strategy, holding period, and risk tolerance.
Conclusion
Understanding what is a liquidity sweep can help traders interpret why price sometimes moves beyond an obvious high or low before changing direction. Most Important: Remember that a sweep is not a reversal. It just means something happened as per market structure but you always have a price action which would come after the sweep that needs to get acceptance and that will be the real reversal. This kind of a wick at the major resistance is just what happens but we don’t give much value until and unless it get acceptance.
In any case the right approach should contain the liquidity as a tool in overall market structure plus some confirmation on top of that along with capital management.
We aren’t trying to pick every sweep.